
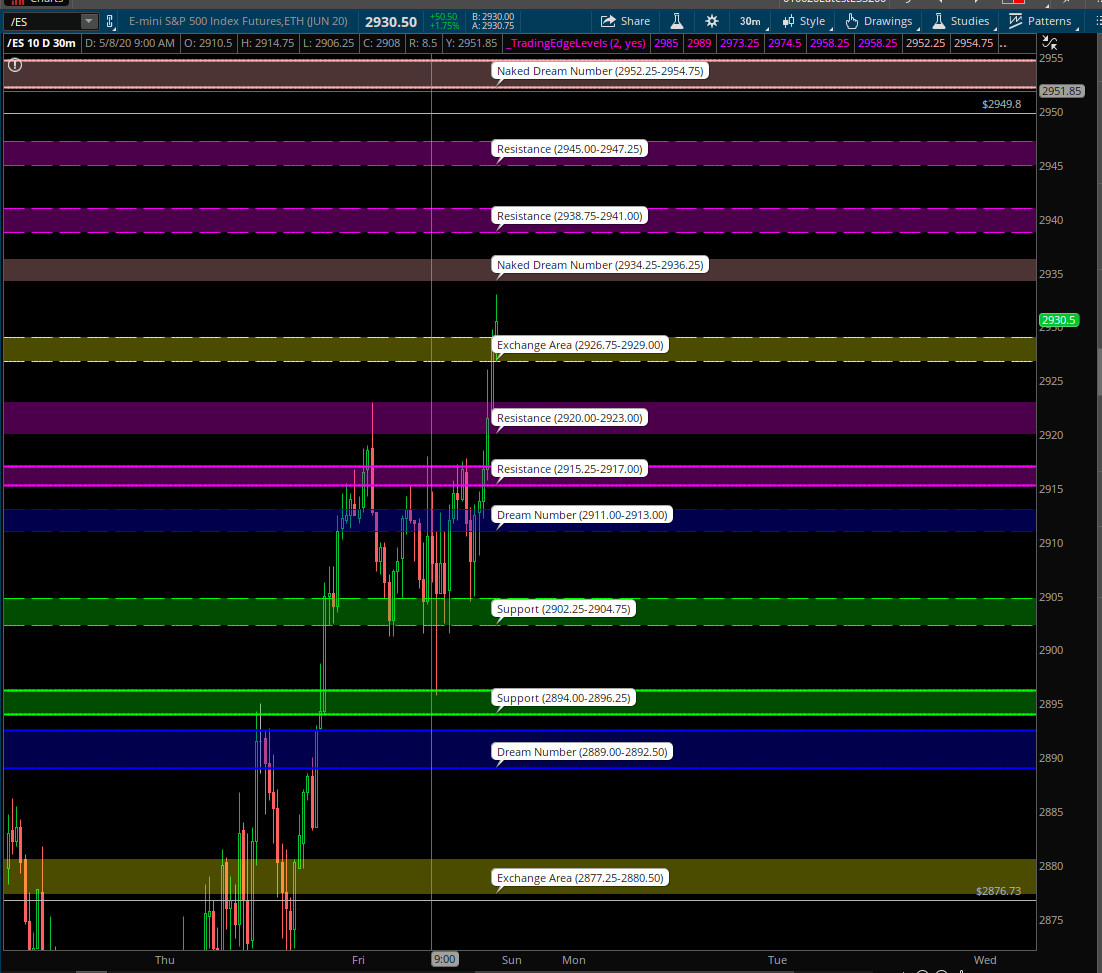
The TradingEdge Visual Price Level Indicator for ThinkorSwim(TOS) automatically plots the Daily Buyer and Seller Interested Levels onto any chart. This visual aid clearly identifies key levels that help you interpret price action and maybe current context depending on where the price is compared to levels during the day. Using the TradingEdge Visual Price Level Indicator with ThinkorSwim makes it easy to stay up to date on the latest price levels/areas.
The indicator can be applied to multiple charts and multiple timeframes. It works by reading the Trading Edge Day Trading Notes – Price Levels text file that is provided to members every morning with the Trade Plan and is only available to Trading Edge Members.
There are many different types of levels to update. Some are more significant than others depending on how they are formed and the daily context. This indicator makes it convenient to accurately update the Daily Buyer and Seller Interested Levels along with their severity and type instead of potentially making mistakes by updating charts manually by hand every morning.
The indicator is priced at a one-time cost of $69 and is only available for sale to Trading Edge members. If you do decide to purchase it then please make sure you are using the correct email address during the purchase process. That email address will be required later in the process to send me an email from that email address to complete the purchase
You can find complete instructions for the indicator in the below video if you are a Trading edge member else you will see the only image.
If you’re already a Trading Edge member & logged in then you will see the option below to purchase the indicator when the indicator is available. If you’re not a member, click on the Get Trading Edge button at the bottom of this page to gain access.